The Earth's magnetic field is generated in the fluid outer core by a self-exciting dynamo process. Electrical currents flowing in the slowly moving molten iron generate the magnetic field. In addition to sources in the Earth's core the magnetic field observable at the Earth's surface has sources in the crust and in the ionosphere and magnetosphere. The geomagnetic field varies in strength,The International System of Units (SI) unit of magnetic field intensity, strictly flux density, most commonly used in geomagnetism is the Tesla. At the Earth's surface the total intensity varies from 22,000 nanotesla (nT) to 67,000 nT. Other units likely to be encountered are the Gauss (1 Gauss = 100,000 nT), the gamma (1 gamma = 1 nT) and the Ørsted. in the order low frequency to high frequency variations, in both the space and time domains. The Earth's magnetic field can be both a tool and a hazard to the modern world.
A geomagnetic observatory is a location where absolute vector observations of the Earth's magnetic field are recorded accurately and continuously, with a time resolution of one minute or less, over a long period of time. The site of the observatory must be magnetically clean and remain so for the foreseeable future. The earliest magnetic observatories where continuous vector observations were made began operation in the 1840s.
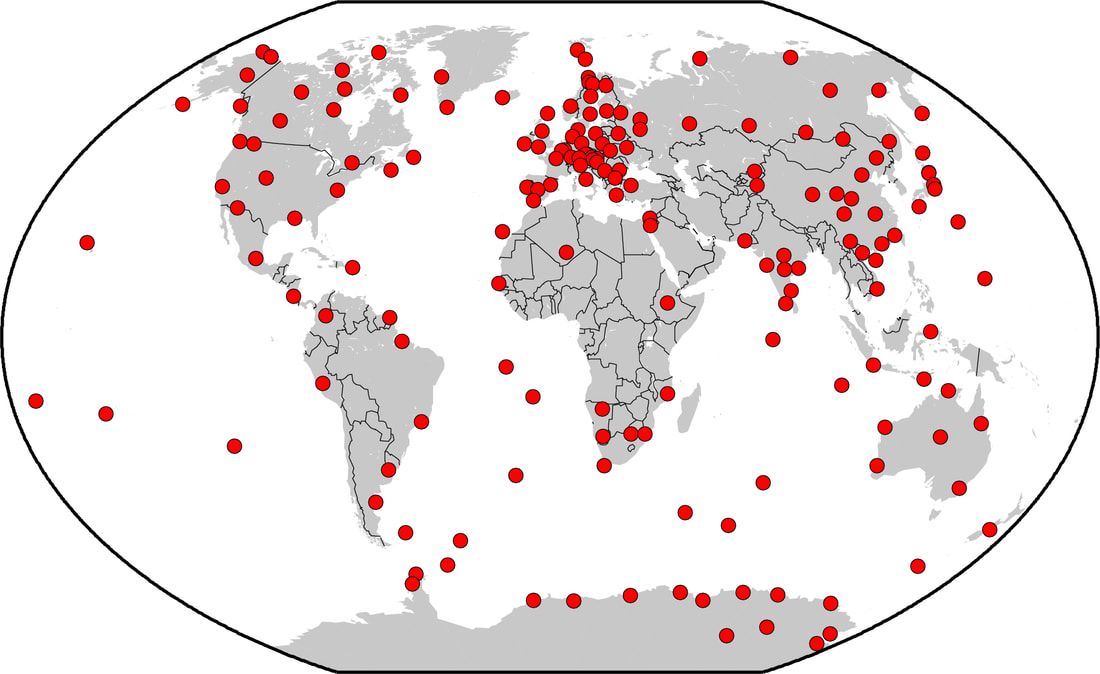
above The locations of currently operating magnetic observatories
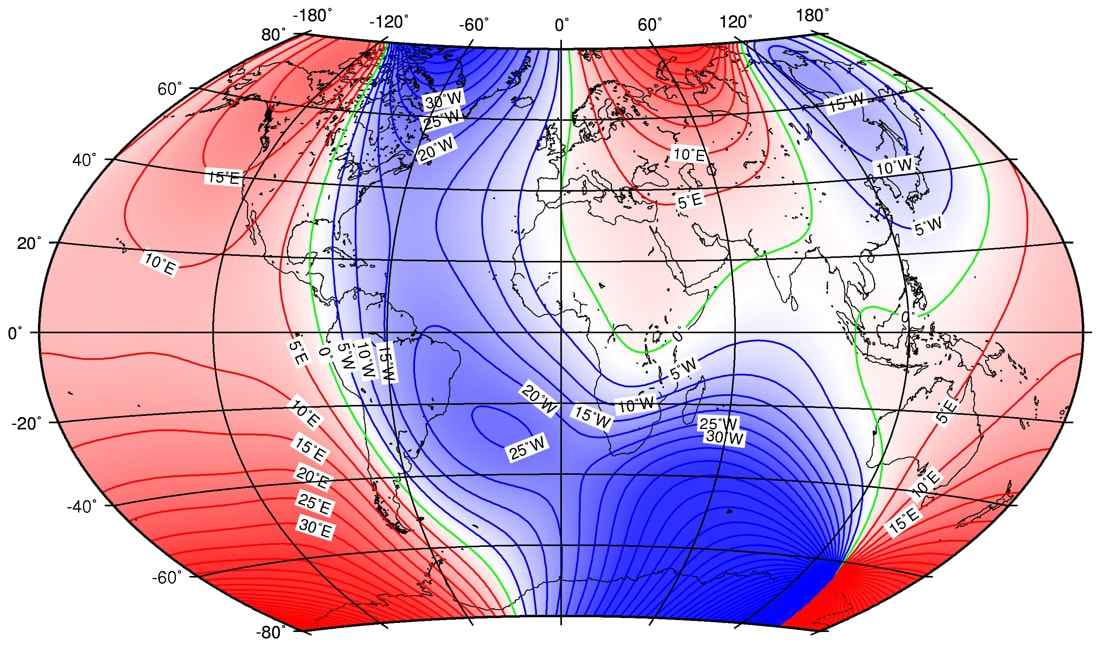
above Map of declination (degrees East or West of true north) at 2015.
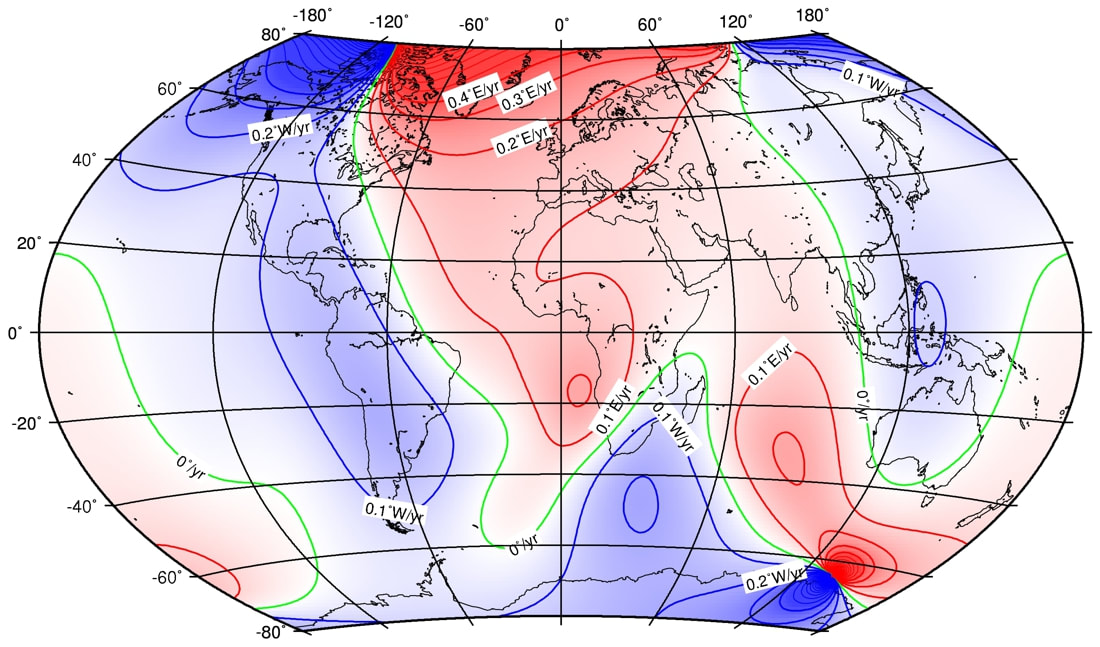
above, Map of predicted annual rate of change of declination (degrees/year East or West) for 2015.-2020.
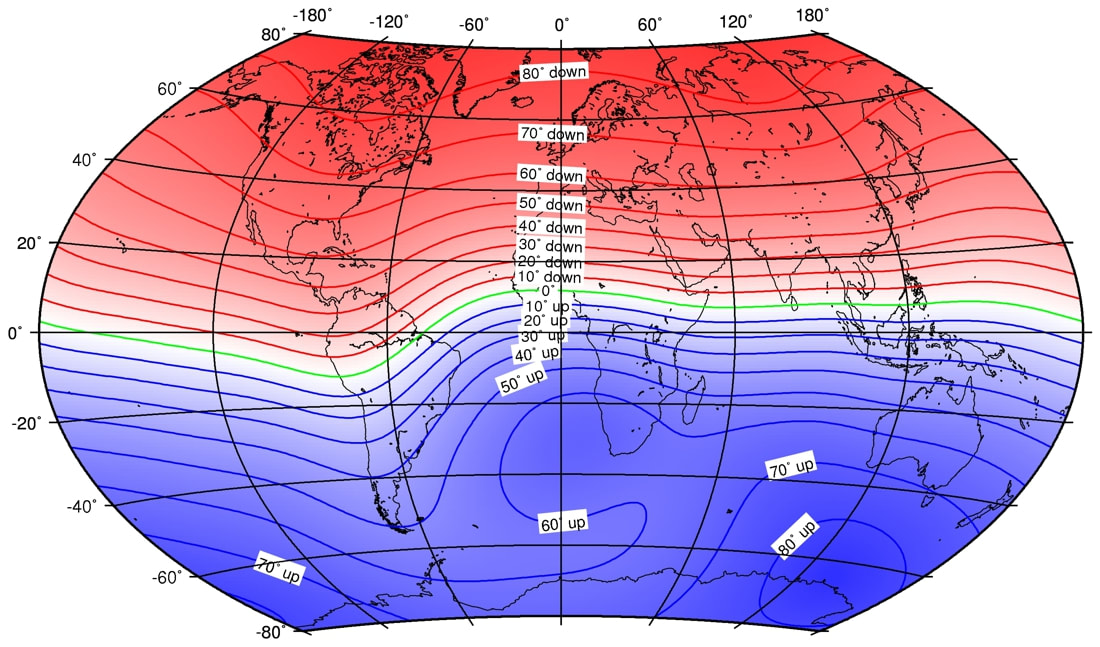
above, Map of inclination (angle in degrees up or down that magnetic field vector is from the horizontal) at 2015.
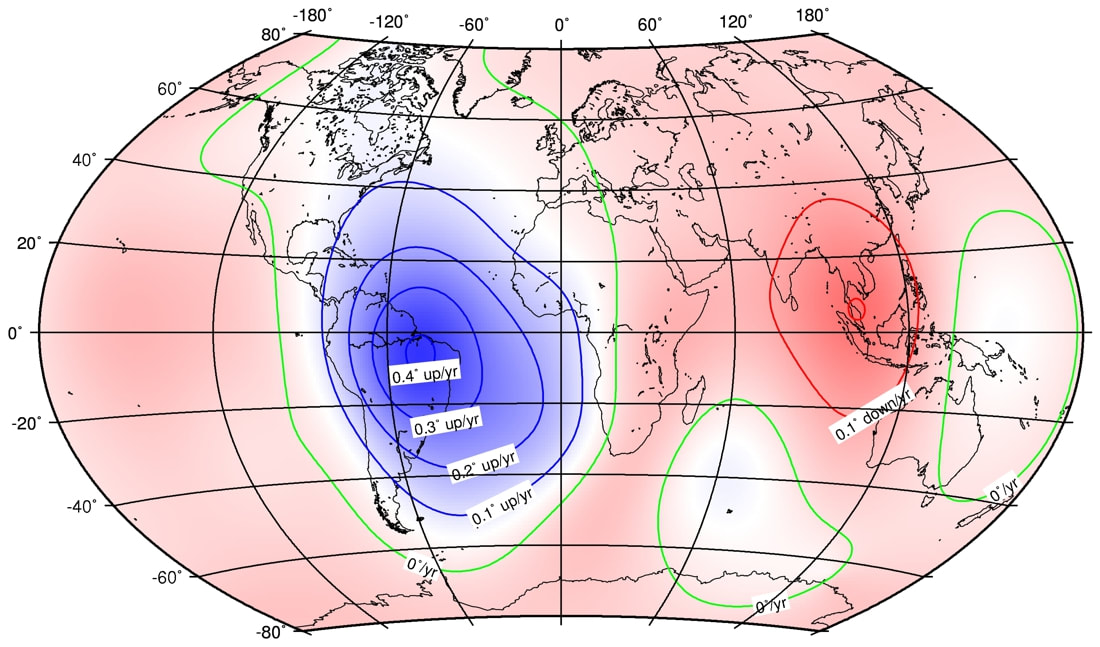
above, Map of predicted annual rate of change of inclination (degrees/year up or down) for 2015.-2020.
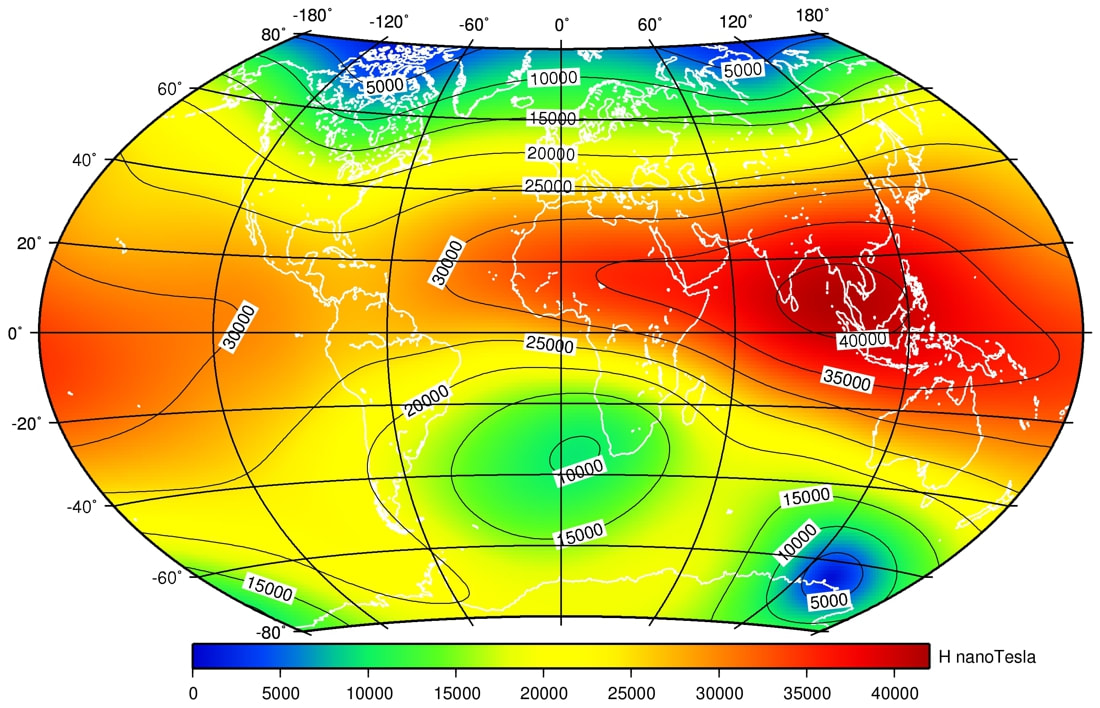
above, Map of horizontal intensity at 2015.

above, Map of predicted annual rate of change of horizontal intensity for 2015.-2020.
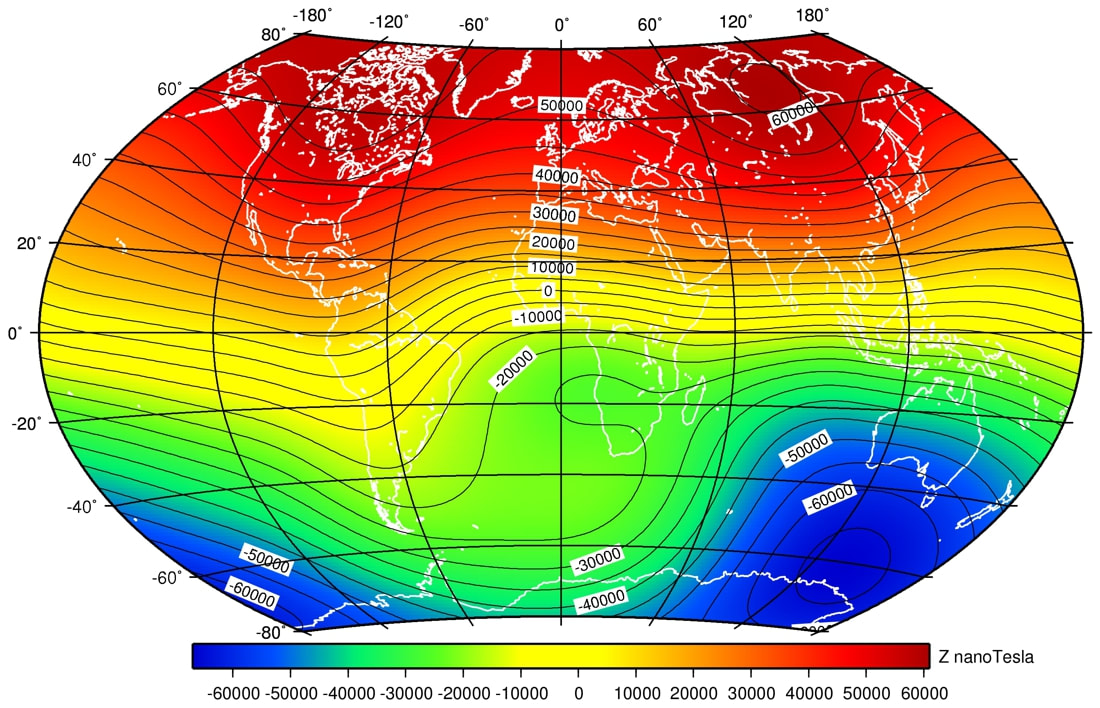
above, Map of vertical intensity at 2015.
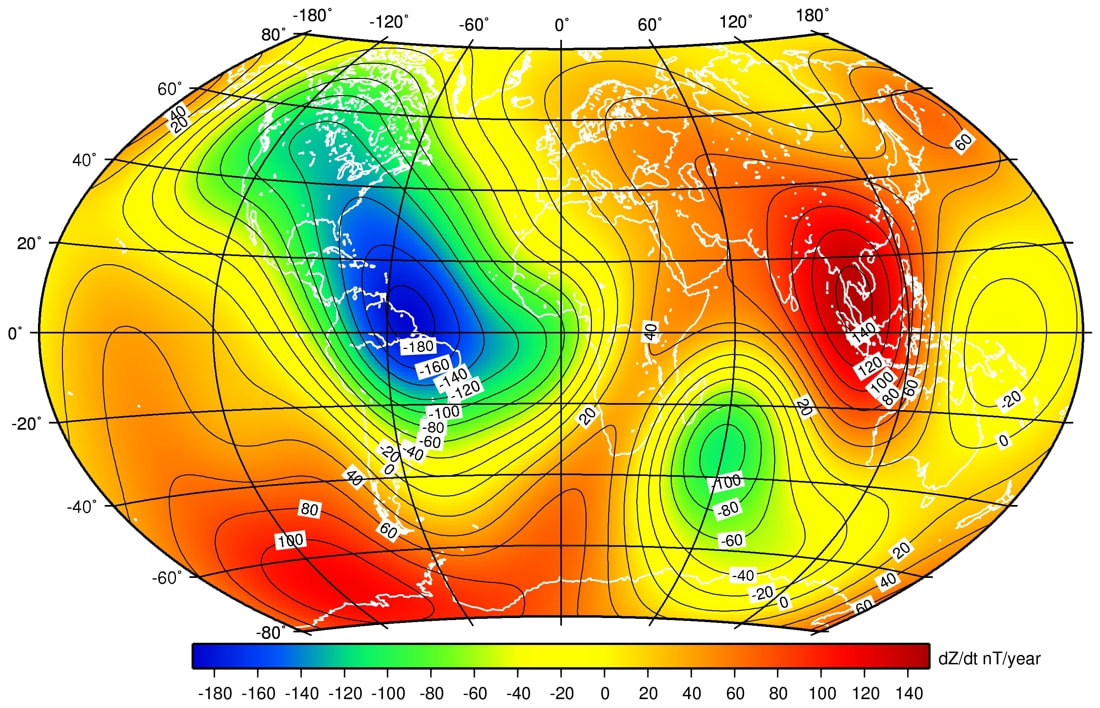
above, Map of predicted annual rate of change of vertical intensity for 2015.-2020.
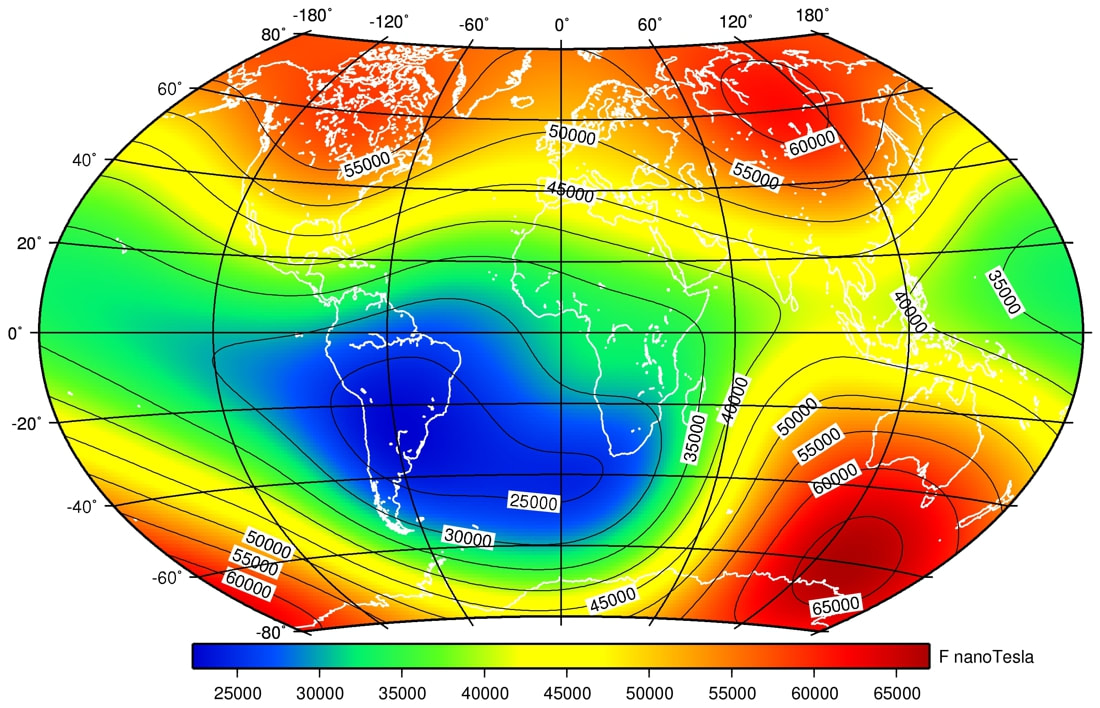
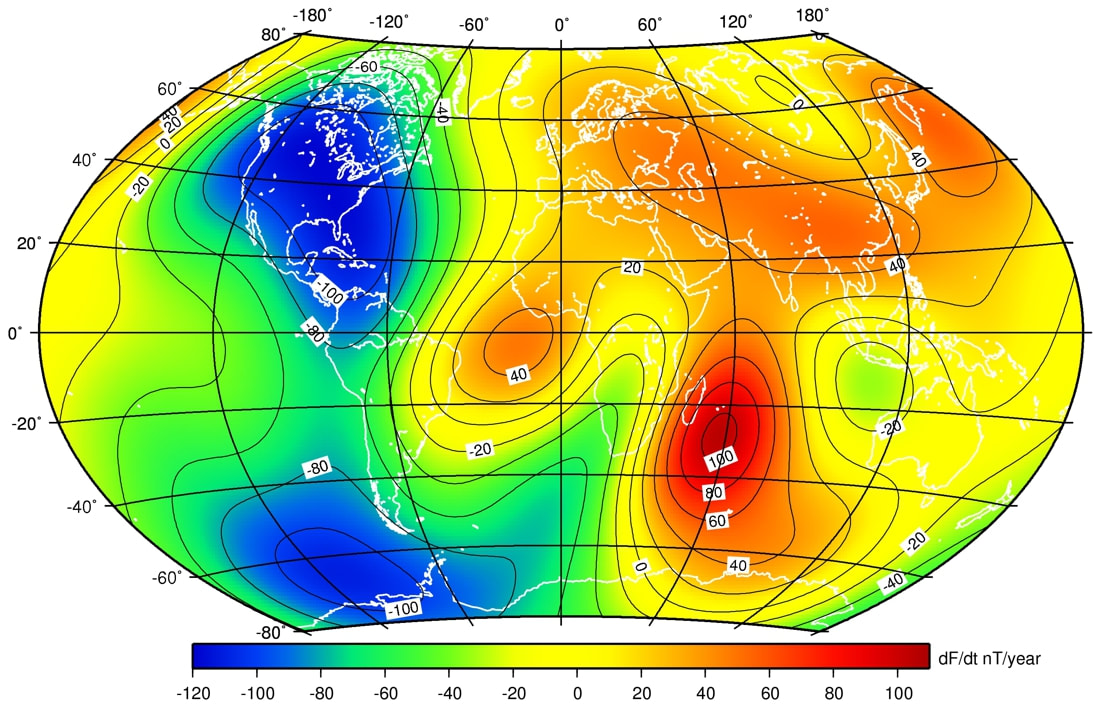
above, Map of total intensity at 2015.0