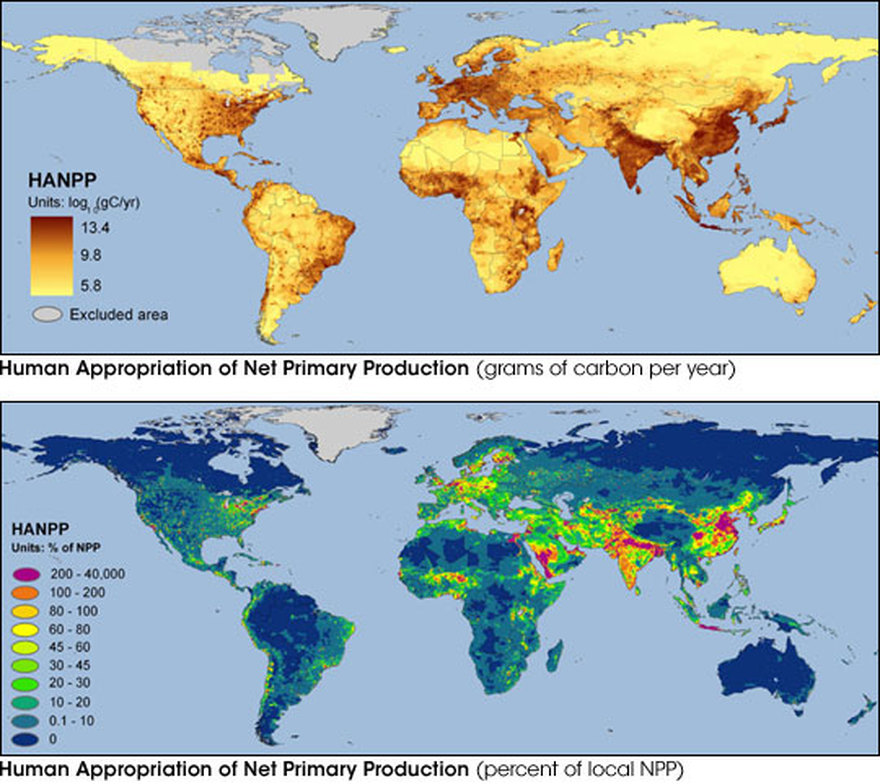
Large images: Grams of Carbon (3.2 Mb JPEG) Percent of Local NPP (4.0 Mb JPEG) In an effort to gauge human impact on ecosystems, scientists at NASA and the World Wildlife Fund recently published estimates of how much of Earth’s plant life humans consume for food, fiber, wood, and fuel. By understanding patterns of consumption, and how the planetary supply of plant life relates to the demand for it, these results may enable better management of Earth�s rich biological heritage. Understanding the patterns of supply and demand is critical for identifying areas of severe human impact on ecosystems and planning for sustainable future growth. The details of this study appear in the June 24, 2004, issue of Nature magazine. Using data collected between 1982-98 by the NOAA Advanced Very High Resolution Radiometer, the researchers calculated the total amount of carbon absorbed by land plants each year and fixed in plant structures—a measure referred to as “Net Primary Production,” or NPP. Then the researchers used computer models to estimate how much of Earth�s land-based net primary productivity is consumed by humans. They found that humans require 20 percent of the NPP generated on land every year. Of course, consumption varies greatly by region and is influenced by three factors: population, per capita consumption, and technology. For more details, please see the NASA press release, entitled NASA Scientists Get Global Fix on Food, Wood, & Fiber Use. The maps above show human appropriation of land-based net primary production. The shades in the top map represent billions of grams of carbon consumed each year for a given location on Earth. Tan shows low values while dark brown shows high values. The bottom map represents the percentage of NPP consumed by humans each year for a given location. The map reveals that in certain places—such as the northeastern United States, much of Europe, the Middle East, as well as Southern and Eastern Asia—humans consume far more of plants’ net primary productivity than is locally produced. Therefore, people living in these areas must import food, fiber, wood, and fuel in order to meet their demands for products derived from plants. NASA
images courtesy Marc Imhoff and Lahouari Bounoua at Goddard Space Flight Center
How MANY PEOPLE CAN THE EARTH FEED?
of 5 people per hectare supported by traditional farming methods, and recycling
of organic matter-ended up with a minimum of 11 billion people.
Numerous other estimates followed, and fit mostly between 10 and 40 billion
people. I will mention a few of the post-World War II values in order
to illustrate different approaches to the challenge.
Brown (1954) concluded that increased yields from existing cultivated
land supplemented by output from about 500 Mha of new fields and 80
Mha of newly irrigated arid lands would raise the 1950 food supply sixfold,
enough to support about 1 5 billion people. Baade (1962), assuming that up
to three times as much cropland as in 1950 could be available, and that
average cereal yields would be 5 t/ha, put the total at 30 billion. Zierhoffer
(1966) arrived at a total of 41 billion people by simply assuming that eventually
every one of 3,350 Mha of the world's potentially arable land would
support as many people as Japan's farmland did during the early 1960s.
Meadows et al. (1972) did not present a maximum value, but their
assumption of doubled 1970 average yields and declining availability of arable
land implied support for a total of 11.5 billion people. Revelle (1976)
calculated that with average global yields equal to half of those in the US
Midwest in the mid- 1970s, with about 10 percent of land in nonfood crops,
and with postharvest losses and nonfood uses at no more than 10 percent
of the yield, the potentially cultivable area outside the humid tropics could
provide a vegetarian diet of 2,500 kilocalories (kcal) per day for nearly 40
billion people.
Extreme carrying capacity estimates go far outside the broad, fourfold
range bracketed by the estimates just cited. They have been defined by true
believers in the antipodal camps of catastrophist and cornucopian futures.
A generation ago Ehrlich (1968) wrote that "the battle to feed all humanity
is over" and that "hundreds of millions of people are going to starve to
death" during the 1970s.2 Ehrlich's global population maximum would have
to be well below the 1970 total of about 3.7 billion people.
In contrast, Simon (1981) maintained that food has no long-run, physical
limit. These extremes leave us either with the prospect of eliminating
about half of humanity in order to return the worldwide count to a supportable
level or with visions of crop harvests surpassing the mass of the
planet itself.3 As Sauvy (1990[1949]: 774) noted crisply, "Lack of precision
in data and in method of analysis allows shortcuts toward reaching an objective
predetermined by prejudice, shaped largely either by faith in progress
or by conservative skepticism." Unfortunately, less extreme estimates have
been hardly more impressive.
Because the question of the ultimate support capacity cannot have a
single correct answer, assessing the value of past estimates must be done
by looking at their assumptions. Too many of them are overly simplistic,
and even the more elaborate ones are usually difficult to defend.